Malaysia is set to experience the ???????????????????????????????????? ???????????????????????????? from November 5, 2024, to March 2025.
????️ ???????????????????????????????????? ???????????????????????????? 2024/2025: ???????????????? ????????????????????
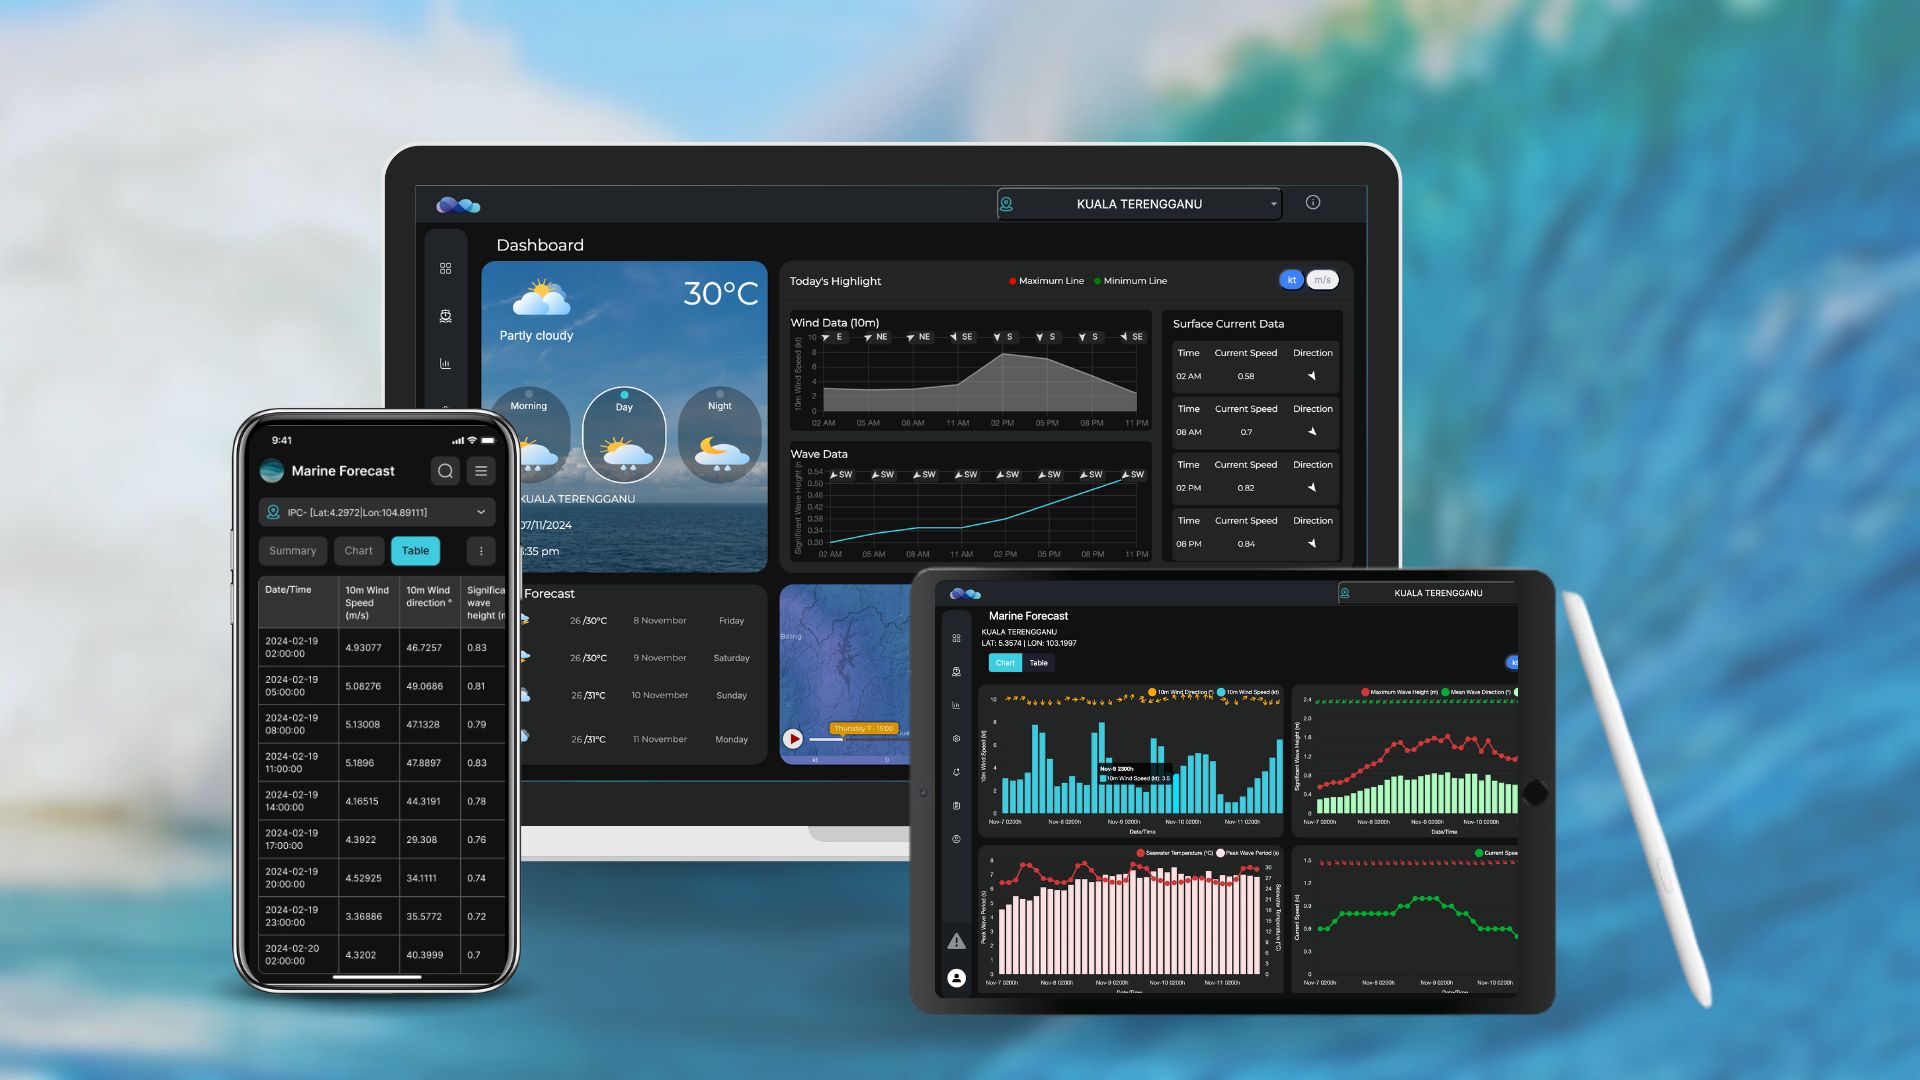
Malaysia is set to experience the ???????????????????????????????????? ???????????????????????????? from November 5, 2024, to March 2025. However, the formation of a typhoon near the northern Philippines has delayed the effects of the monsoon in Malaysia. When the monsoon begins fully, areas such as ????????????????????????????????, ????????????????????????????????????????, ????????????????????????, ????????????????????, ????????????????????, ???????????? ???????????????????????????? will face heavy rainfall exceeding average levels. Additionally, strong and persistent ???????????????????????????????????????????????????? ???????????????????? will lead to rough seas and high waves along Malaysian waters and shipping routes. This poses significant risks to the shipping industry, port operations, and other maritime-related sectors. Stakeholders are advised to remain vigilant and prioritize safety in daily operations by monitoring weather and sea conditions closely. To support industries in navigating these challenges, ???????????????????????????????? ???????????????????????? ???????????????????????????????? ???????????????????????? (????????????????????) provides the ultimate solution. MFAST delivers highly accurate and comprehensive marine weather forecasts, including ????????????????????, ????????????????????, ????????????????????????????????, ???????????????????????????????????????????? ???????????? ????????????????. With its ???????????????????? ???????????????????????????????????????????????? feature, users receive early warnings about adverse weather or hazardous marine conditions, ensuring safety and operational efficiency. Additional features include interactive dashboard, automatic reporting, and location-specific forecasts, helping the industry get up-to-date insights. Interested in how MFAST can enhance your operations? ???????????????????????????? ???????? ???????? ????????????????????@????????????????????????????????????????.????????????.???????? for more details and sign up for your ???????????????? ???????????????????? ????????????????????. Don’t let unpredictable marine weather disrupt your plans—stay informed and prepared with MFAST ❗ ???????????????????? – ???????????????????????????? ???????????????????????? ???????????????????????????? ????????????????????????????????????, ???????????????????????????? ???????????????????????????????????? ???????????? ???????????????? ????????????????????????????????????????. #MFAST #ocean #forecast #oceanhydro
A ???????????????????? ???????????????????? is one of the most dangerous and destructive natural events that occur during severe weather conditions, such as tropical storms and hurricanes. It refers to the abnormal rise in sea level above the predicted astronomical tide.
???? ???????????????????????????????????????????????????? ???????????????????? ???????????????????? ????
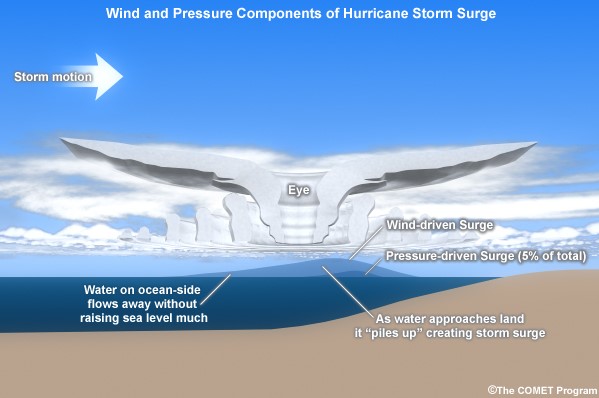
A storm surge forms when strong winds from a storm push ocean water toward the coast, resulting in a significant rise in sea level. Here’s a breakdown of the key processes involved: ???? ????????????????-???????????????????????? ???????????????????? ????????????????????????????????????????????????: The strong winds of a storm act as a driving force that pushes ocean water toward the coastline. This creates a dome of water that moves in conjunction with the storm. ???? ???????????? ???????????????????????????????????????????? ????????????????????????????????: As a storm approaches, the atmospheric pressure drops. Lower pressure causes water levels to rise slightly because the reduced pressure allows the water to expand. ???? ???????????????? ????????????????????????: The storm’s intense winds generate large waves, which increase the water level further when they reach the shore. ???? ???????????????????????????? ???????????????????????????????????????????? ???????????????????? ???????????????????? ???????????????????????????????????? ???? ???? ???????????????????? ????????????????????????????????????: Stronger storms with high wind speeds push more water toward the shore, creating a higher surge. ???? ???????????????????? ????????????????: Larger storms displace a greater volume of water over a wider area, its size can cause a large storm surge because it affects a larger expanse of the ocean. ???? ???????????????????? ????????????????????????????????????????: If a storm surge occurs during high tide or spring tide, the water levels will be even higher, leading to more severe flooding. ???? ???????????????????????????? ????????????????????????????????????????: Coastal areas with gradually slopes are more vulnerable to high storm surges. The shallow water allows more energy to be transferred from the wind, pushing water farther inland. Storm surges cause massive flooding in low-lying coastal areas. The combination of surge-driven flooding and heavy rainfall often results in extensive inland flooding. Saltwater from the surge can also contaminate freshwater systems. Beaches, dunes, and barrier islands can be washed away, resulting in permanent land loss. Natural protective features, such as sand dunes and mangroves, may be destroyed, leaving the coastline more vulnerable to future storms. Coastal infrastructure is highly susceptible to damage during a storm surge. Buildings, roads, bridges, and ports can be heavily damaged or destroyed by storm surges. Storm surges are dangerous and destructive, caused by powerful winds and low-pressure during storms. The size of the surge depends on various factors like storm strength, coastal shape, and tides. The effects can be devastating, leading to flooding, erosion, and long-term damage to coastal communities and the environment. Being prepared and understanding these risks is crucial for reducing the impacts of storm surges. #mfast #ocean #forecast #oceanhydro
Accurate ocean forecasts are vital for ensuring safety and efficiency in marine environments.
? ?????????? ?? ????? ????????? ?????? ?????????? ?
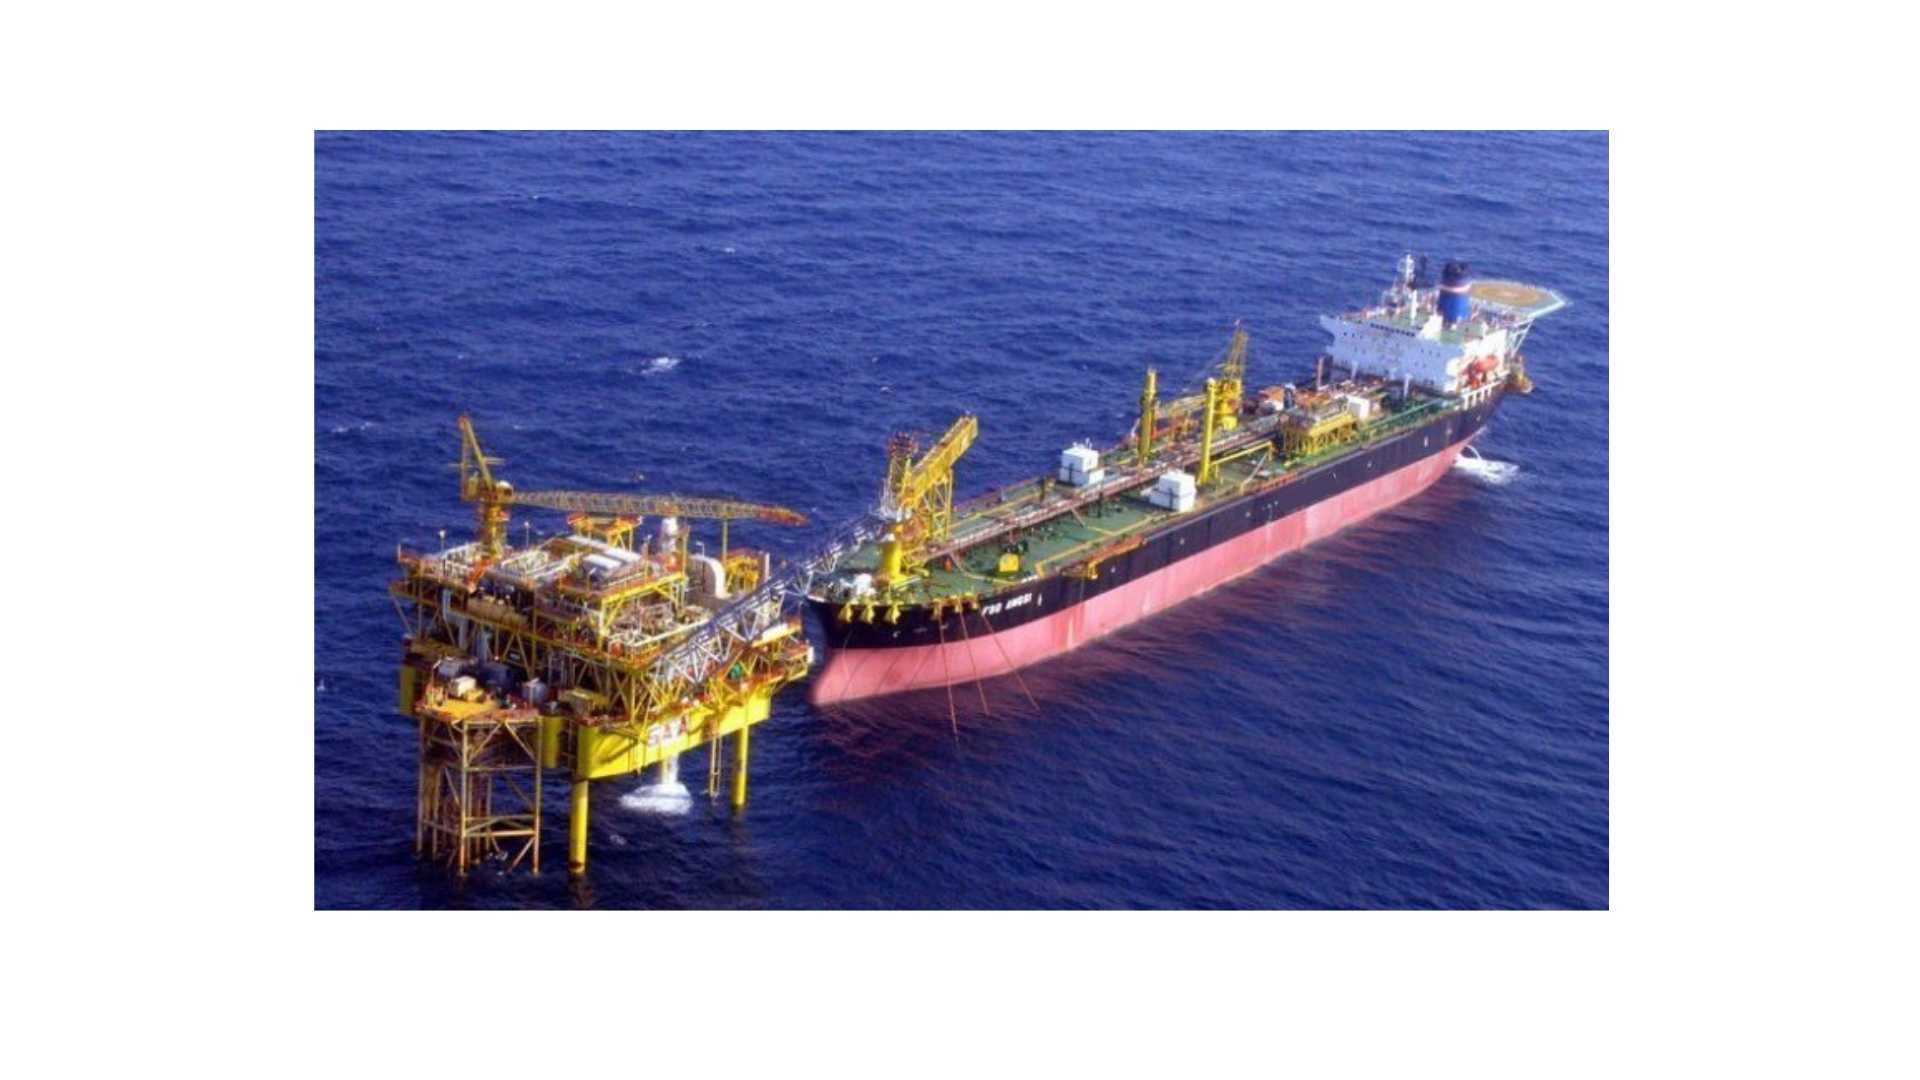
Accurate ocean forecasts are vital for ensuring safety and efficiency across various sectors. By providing essential data on winds, waves, currents, and weather conditions, these forecasts help companies optimize operations and make informed decisions. Let’s explore how ocean forecasts are important in enhancing industry operations:\r\n\r\n? ???????? & ?????: By predicting winds, waves, and currents, companies can optimize routes, reduce accidents, and improve turnaround times. For example, ports can plan docking times and loading and unloading operations based on wave height forecasts. According to the International Maritime Organization, accurate weather forecasting can reduce maritime accidents by up to 30%.\r\n\r\n? ??? & ???: Reliable forecasts enable safe offshore operations, guiding maintenance and evacuation during severe weather to protect personnel and equipment. Accurate data on sea conditions helps in planning exploration and drilling activities, ensuring that operations are both safe and efficient even in challenging environments.\r\n\r\n? ??????? & ??????????: Accurate forecasts help plan safe activities like diving, swimming, and sailing, ensuring enjoyable experiences for tourists while minimizing disruptions. Tour operators can use these forecasts to schedule activities at the best times, enhancing customer satisfaction and safety.\r\n\r\n? ????????? ??????: Offshore wind farms rely on precise forecasts to optimize energy production and schedule maintenance, enhancing operational efficiency. These forecasts ensure that turbines operate at peak efficiency and maintenance is conducted during favorable weather conditions, maximizing energy output and minimizing downtime.\r\n\r\nAccurate ocean forecasts are indispensable for various industries. They not only support operational needs but also drive sustainable practices and innovation. Embracing the power of ocean forecasting can lead to safer, more efficient, and environmentally conscious operations across the globe.
Climate change is one of the most pressing environmental challenges of our time
??? ????? ????????? ?? ??????? ?????? ?? ??? ????? ?
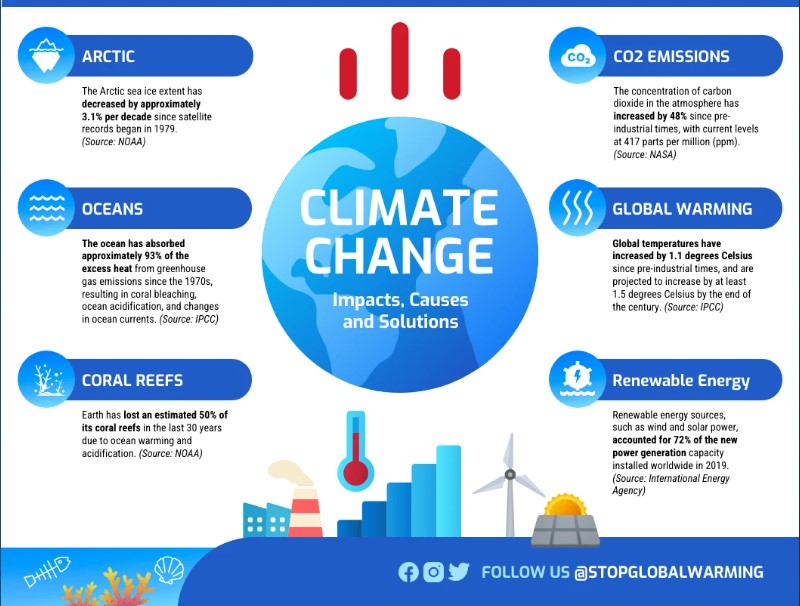
Climate change is one of the most pressing environmental challenges of our time, with profound impacts on the world's oceans. As global temperatures rise due to increased greenhouse gas emissions, our oceans are undergoing significant changes that have far-reaching consequences for marine life, coastal communities, and the overall health of the planet. ❗ ??? ?????? ?? ??????? ?????? ?? ??? ????? ❗ ?????? ??? ??????: One of the most visible effects of climate change is the rising sea levels, caused by the melting of polar ice caps and the thermal expansion of seawater as it warms. This leads to the inundation of coastal areas, increased flooding, and the erosion of shorelines, threatening habitats and human settlements. Big cities in the Asian region, such as Jakarta, Ho Chi Minh City, and Bangkok, as well as northern states of Peninsular Malaysia have the highest probabilities of experiencing the worst effects of sea level rise due to climate change. ????? ?????????????: The absorption of excess carbon dioxide (CO2) by the oceans results in a chemical reaction that lowers the pH of seawater, making it more acidic. Ocean acidification adversely affects marine organisms, particularly those with calcium carbonate shells and skeletons, such as corals, mollusks, and some plankton species. ??????? ?? ????? ????????: Climate change can alter ocean currents, which play a crucial role in regulating the planet's climate and supporting marine life. Changes in currents can affect weather patterns, nutrient distribution, and the migration and distribution of marine species. Understanding and mitigating the impacts of climate change on the ocean requires comprehensive data and robust scientific research. Ocean Hydro is committed to support this vital research by supplying high-quality data for the study of climate change and its effects on the ocean. Feel free to contact us for more information on how we can support your research with our data.
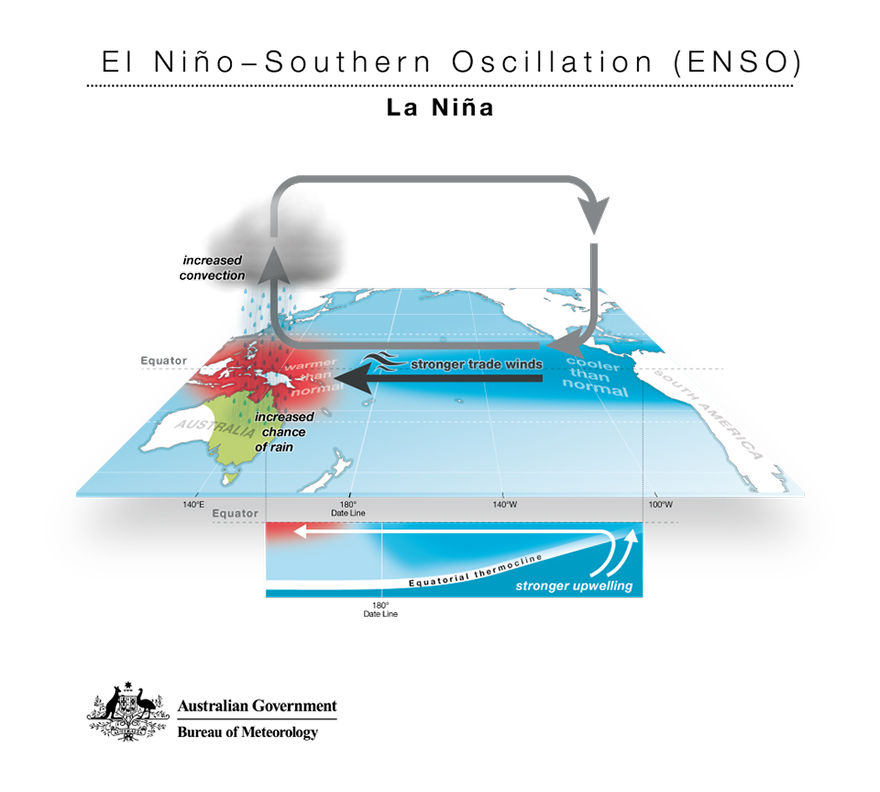
La Nina is characterized by cooler-than-average of sea surface temperature at the central and eastern Pacific Ocean.
?????????????? ?? ?????
La Nina is a natural climate phenomenon which refers to the periodic cooling of sea surface temperatures in the central and eastern Pacific Ocean, and it is a natural part of the El Niño-Southern Oscillation (ENSO) cycle. La Niña events typically develop every two to seven years and can persist for several months to over a year. El Niño is characterized by warmer-than-average sea surface temperatures in the central and eastern Pacific Ocean, La Niña, its cooler counterpart, brings about its own distinctive set of weather patterns across the globe. La Nina occurs when the trade wind at the Pacific Ocean (blow from east Pacific to west Pacific) becomes stronger. This will push warmer surface water to the western side of the Pacific Ocean which is Asian region. This leads to an upwelling of cold, nutrient-rich waters along the coasts of South America. As a result, cooler-than-average sea surface temperatures prevail in the central and eastern Pacific while western Pacific experience warmer surface water. The effects of La Niña are far-reaching and can influence weather patterns across the globe. It can exacerbate existing weather extremes, leading to droughts in some regions and flooding in others. La Nina will cause the Southeast Asian region to experience more rainfall, cooler temperature and increase in flooding cases. Conversely, parts of Africa and South America region will face warmer and dryer conditions. La Niña also tends to enhance hurricane activity in the Atlantic Basin while suppressing it in the Pacific Basin. This can lead to an increase in the number of hurricanes and tropical storms forming in the Atlantic, potentially posing risks to coastal communities. Meteorologists closely monitor sea surface temperatures, atmospheric pressure patterns, and other indicators to predict the onset and intensity of La Niña events. Advanced climate models and data from satellites and ocean buoys help forecasters anticipate its potential impacts on weather patterns months in advance, allowing governments and communities to prepare and mitigate risks. In conclusion, La Niña is a natural climatic phenomenon with far-reaching effects on weather patterns worldwide. Understanding its causes and impacts is crucial for policymakers, meteorologists, and communities to better prepare for and adapt to the associated weather extremes. As our understanding of climate variability continues to evolve, so does our ability to anticipate and respond to events like La Niña, ultimately contributing to greater resilience in the face of a changing climate. #lanina #Climate#event #oceanhydro
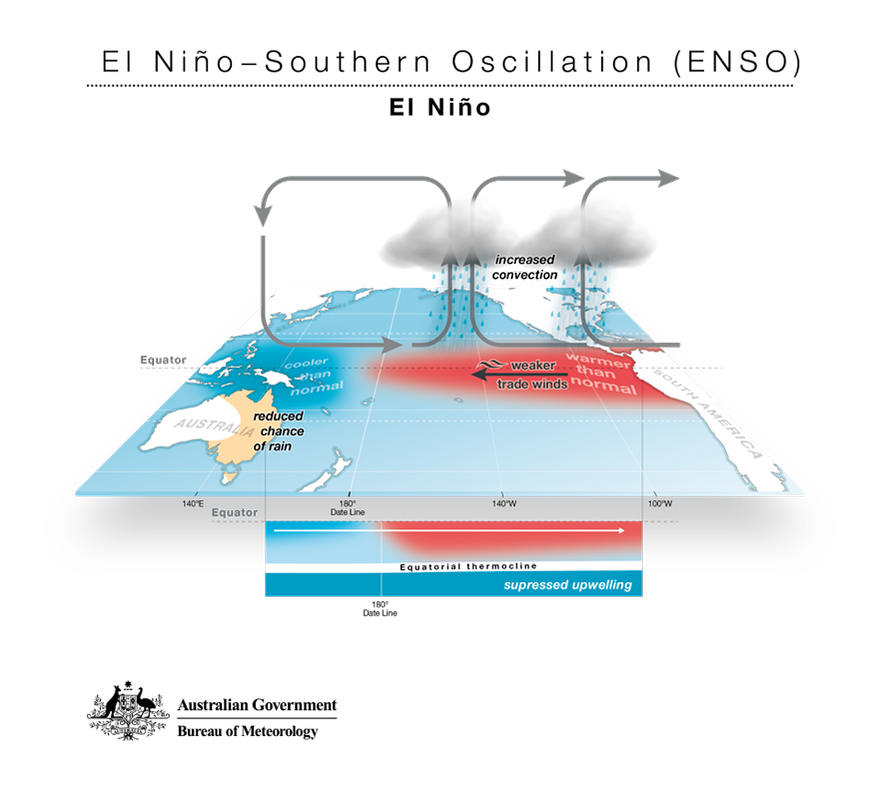
El Niño is characterized by warmer-than-average sea surface temperatures in the central and eastern Pacific Ocean.
? ????????????? ?? ??ñ? ?
El Niño is a natural climate phenomenon that occurs in the Pacific Ocean. Originating in the Pacific Ocean, particularly along the equator, El Niño showcases the complex interplay between oceanic and atmospheric systems. This climate event typically lasts about 9 to 12 months, but sometimes it can extend beyond (NOAA, 2023). El Niño is characterized by warmer-than-average sea surface temperatures in the central and eastern Pacific Ocean, leading to significant shifts in weather patterns worldwide. Under normal conditions in the Pacific Ocean, the trade winds blow from east to the west part of the Pacific Ocean. This strong wind helps to drive ocean currents and maintain the normal circulation patterns in the region. During El Nino, this trade wind weakens and causes the warm water from west Pacific Ocean to move to the eastern side of Pacific Ocean making the sea surface temperature at the central and eastern Pacific Ocean become warmer than usual. This will cause Asian region to experience drought, dry and warmer than usual while vice versa to the eastern Pacific Ocean. They will experience storms, heavy rain, flooding and being wetter. With the weather changes in these two regions, it can have profound consequences for agriculture, water resources, and ecosystems, often leading to crop failures, water shortages, and even displacement of populations. El Niño and upwelling events in the Pacific Ocean are connected. Upwelling involves nutrient-rich waters rising from the deep ocean to the surface, supporting marine life and affecting local climates. Normally, strong trade winds push surface water away from the Pacific coast, causing cold, nutrient-rich waters to well up. During El Niño, this process weakens or stops along the South American coast, disrupting nutrient supply to surface waters. This affects marine life and fisheries. Understanding this relationship is crucial for predicting climate changes, managing fisheries, and protecting marine biodiversity. Moreover, El Niño can influence global temperatures. The excess heat stored in the tropical Pacific Ocean during these events can contribute to a rise in global temperatures, exacerbating the effects of climate change. However, El Niño also plays a crucial role in regulating the Earth's climate system. Its periodic occurrence helps redistribute heat around the globe, impacting weather patterns in ways that are essential for maintaining the planet's climate balance. In conclusion, El Niño serves as a reminder of the intricate dynamics of our planet's climate system. While it can bring both benefits and challenges, studying El Niño offers valuable insights into Earth's interconnected environmental processes and underscores the importance of proactive climate action to build resilience and adapt to changing conditions.
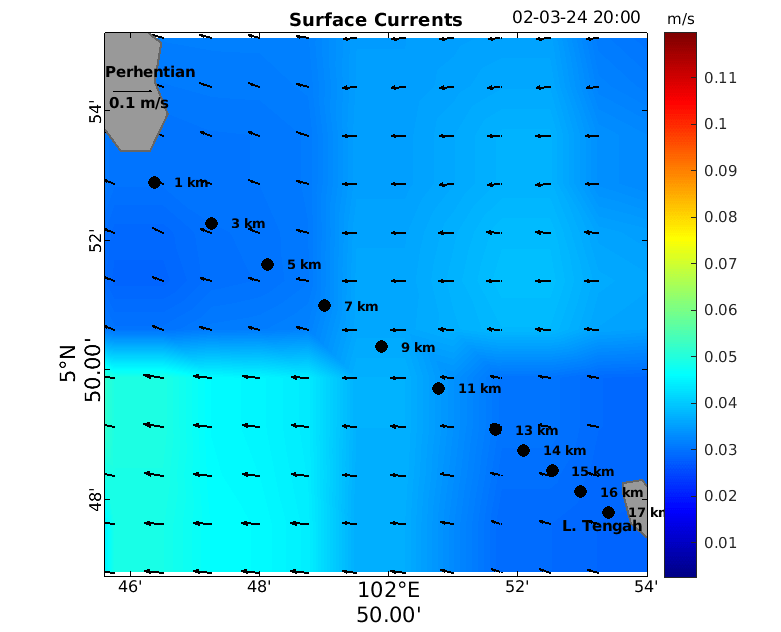
Surface Current Speed and Direction from Perhentian Island to Lang Tengah Island on 2/3/2024; 20:00
⛔How OHSB Support Enthusiast Recreational Swimmer For Safety⛔
Swimming is the most popular form of ocean recreation due to its simplicity and the minimal requirement for extra equipment. Many open ocean swimming events and competitions organized annually in Malaysia such as Perhentian 16KM Challenge, PD 10KM & PARA OWS, Ironman Langkawi, Kapas Marang SWIM, and OCEANMAN Malaysia. However, swimming also records the highest number of drowning incidents, disappearances, and fatalities. This article would like to focus on how ocean forecast data are crucial for open water swimming activities either to utilize swimmer performance or provide safety, especially for those participating in swimming marathons or long-distance swims. ? Swimmers’ safety: Knowing the forecasted conditions such as wave height, wind speed, currents and tidal helps swimmers assess the risks associated with their swim. It allows them to make informed decisions about whether it's safe to swim and to take necessary precautions. ? Performance During Activity: Ocean forecasts allow swimmers to choose the best time and location for their swim by identifying areas with favorable currents or avoiding areas with strong waves or dangerous marine conditions. This allows swimmers to optimize their performance by selecting conditions that are conducive to faster and more comfortable swimming as well as minimize resistance. ? Emergency Preparedness: In the event of unexpected changes in weather or ocean conditions, swimmers who are well-informed about the forecast can react quickly and take appropriate action to ensure their safety. ? Planning: Understanding ocean forecasts helps in scheduling activities at times when weather and sea conditions are most favorable. People or organizers can avoid scheduling events during periods of high winds, rough seas, or inclement weather. From the article, it is evident that ocean forecast data is invaluable for any ocean recreation activities. Thus, the Malaysia Marine Forecasting System (MFAST) developed by Ocean Hydro serves as an exemplary model that supplies ocean forecast data not only for ocean recreational but also support business used such as oil and gas, shipping, and marine consultant. Feel free to contact us and learn more about ocean forecast service. Example Ocean Forecast for Perhentian-Lang Tengah Solo Swim 2024: https://lnkd.in/gs4CG6Zu
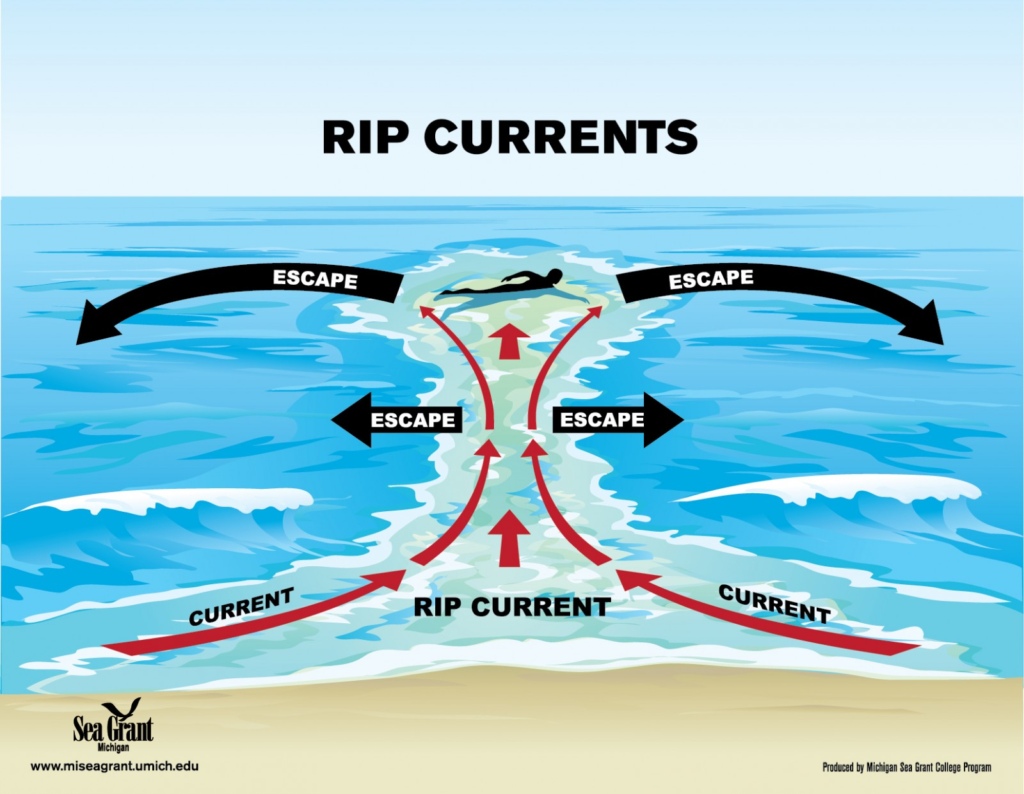
Image show how to escape if someone trapped by rip current.
Understanding Rip Currents
Recently, we were shocked by news of a tourist drowning after being caught in a rip current while vacationing at the beach. Therefore, this article is written to enhance general understanding of what rip currents are, so that we can all avoid being caught in these currents and safely enjoy beach outings.\r\nRip currents are powerful, narrow channels of fast-moving water that can pull even the strongest swimmers away from the shore and into deeper waters (NOAA, 2023). While they\'re a natural occurrence, they can catch beachgoers off guard if they\'re not aware of how to identify and navigate them safely. Rip currents may vary in width from very narrow to spanning hundreds of yards. Similarly, their seaward pull can differ; while some rip currents cease just beyond the breaking waves, others persist and can push hundreds of yards offshore. Rip currents often appear as darker, choppier patches of water amidst calmer surroundings. They typically form in breaks in sandbars or near structures like piers and jetties. Recognizing these visual cues can help beach enthusiasts steer clear of these hazardous areas.\r\nIf caught in a rip current, it\'s crucial to remain calm and remember to swim parallel to the shore rather than directly against the current\'s pull to escape its grip safely. Instead, remember these crucial tips:\r\n• Stay Calm: It\'s easier said than done, but panicking only expends energy and impairs judgment. Remind yourself that rip currents won\'t pull you under; they\'ll simply carry you away from shore.\r\n• Don\'t Fight It: While the instinct may be to swim directly back to shore, this can be futile and exhausting. Instead, swim parallel to the shoreline. Rip currents are often narrow, and swimming perpendicular to the current\'s flow can help you escape its pull.\r\n• Float and Signal: If swimming parallel feels too difficult, conserve energy by floating on your back and signaling for help. Remember, rip currents typically flow outward, so staying afloat and signaling increases your chances of being spotted by lifeguards or fellow beachgoers.\r\n• Know When to Ask for Help: There\'s no shame in seeking assistance. If you\'re struggling or feeling exhausted, signal for help immediately. Beaches often have lifeguards trained to handle these situations, so don\'t hesitate to call for aid.\r\nShare this knowledge with your friends and family to ensure everyone can safely enjoy beach settings and remain cautious of any rip current occurrences.\r\n

A significant visit to the Petronas Office on January 4, 2024.
Ocean Hydro Visit to PETRONAS Office
Location: Petronas Tower 3 Date: 4 January 2024 Ocean Hydro visit to the iconic Petronas Office on January 4, 2024, unveiled opportunities for strategic discussions on potential collaborations. Thrilled to promote and introduce our revolutionary product, the Malaysia Marine Forecast System (MFAST). Grateful for the opportunity to explore synergies and build connections for future success.
It was an honor to be visited by the esteemed team from Dr. Nik & Associates.
Dr. Nik & Associates Visit to Ocean Hydro and INOS
Location: INOS, Universiti Malaysia Terengganu. Date: 10 January 2024. The purpose of their visit to Ocean Hydro was to gain a closer understanding of our products and services, with the aim of fostering collaboration. We are proud to announce that Dr. Nik & Associates has taken the opportunity to benefit from our FREE TRIAL version of the MFAST website. Looking forward to the possibilities that lie ahead!

Late October and November bring the monsoon season on the eastern side, with heavy rain, strong winds, and choppy seas, making travel more difficult. On the west coast, the weather remains mild and dry, with little rainfall until February.
Monsoon Season
The weather in Malaysia is characterized by two monsoon regimes, namely the Southwest Monsoon that starts from late May to September, and the Northeast Monsoon from November to March. The Northeast Monsoon brings heavy rain especially to the states on the east coast of Peninsular Malaysia, west of Sarawak and east of Sabah, while the Southwest Monsoon relatively shows drier weather. The transition period between these two monsoons is known as the inter-monsoon phase. Monsoon occurs due to the temperature difference between the land and the ocean as a result of the heating of the sun\'s rays. During winter, the landmass of the continent cools faster and causes extremely low temperatures in Central Asia. This situation caused the atmospheric pressure to increase and formed a very strong high pressure system (anticyclone) in Siberia. As a result, cold air moves out of Siberia as a northwesterly wind and then turns into a northeasterly wind when it reaches the coastal waters of China before heading to Southeast Asia. The Malaysian Meteorological Department (MetMalaysia) predicted that the northeast monsoon period would begin on 7 November 2022, which was earlier than expected and continue until March 2023. This prediction has now materialized and the current monsoon rain will continue through March. This persistent raining, which has deteriorated since 28 February 2023, has caused flooding in the Malaysian peninsula, affecting the states of Johor, Melaka, Negeri Sembilan, Pahang and Selangor. Johor is the worst-hit state with more than 42,000 people evacuated to relief centres since 4 March 2023, compared to 9,162 on 1 March. There has been ongoing flooding from the same monsoon season which started in December 2022, but the current flooding is above average, as a similar scope which has never been experienced in March. Earlier in February 2023, Johor experienced minor flooding, which was expected in terms of timing and scale, but the scale of current flooding is extraordinary. The inter-monsoon season is expected to begin on Thursday (March 2023) and continue until mid-May, marking the end of the Northeast Monsoon which began on Nov 7 last year. Malaysian Meteorological Department (MetMalaysia) director-general Muhammad Helmi Abdullah, in a statement, said during this phase, the country would receive weak winds from various directions which would form thunderstorms that usually bring heavy rain and strong winds in a short period. \"This normally happens in the afternoon and late evening in most areas on the west coast and interiors of the Peninsular, western Sabah as well as central Sarawak. These conditions have the potential of causing flash floods and damage to unstable structures\" he said.
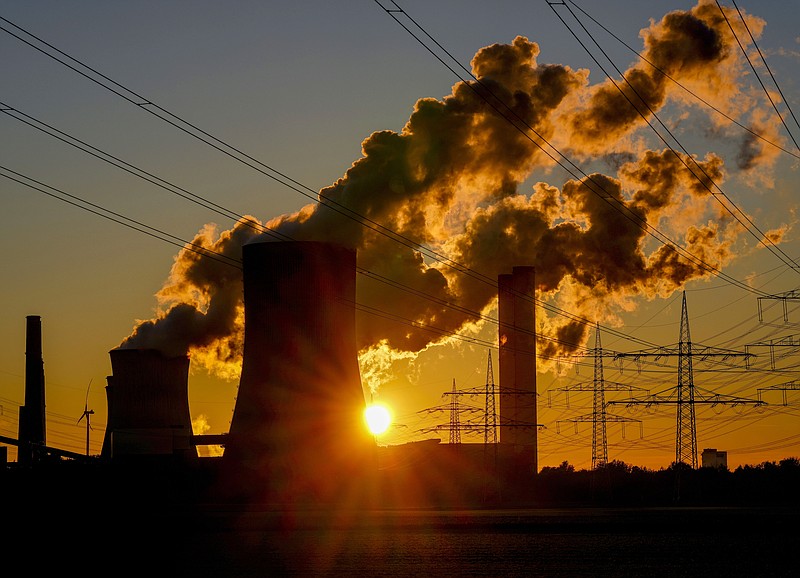
Malaysia is among the most vulnerable regions in Southeast Asia to climate change. The world has already warmed by 1.2°C, and we may have passed the 1.5°C threshold by 2030.
Global Warming
It is important to remember that staying below 1.5°C requires a global effort. As a result, even if Malaysia achieves net zero status 30 years from now, or even tomorrow by halting all emission, the country will continue to face a slew of climate hazards. In 2023, Malaysia must priorities adaptation and climate resilience, particularly at the local level. According to IPCC reports released last year, Malaysia is among the most vulnurable regions in Southeast Asia to climate change. The world has already warm by 1.2°C and we may passed the 1.5°C threshold by 2030. The goverment must expedite the development of the National Adaptation Plan, which has been in the works since 2015. It would be ideal if the goverment could implement a resilient town and city transformation agenda to address climate change impacts and disaster risk more holistically.\r\n Malaysia must start developing a clear strategy for climate-smart trade and investment. Prospective market-based instruments such as carbon tax and an emission trading scheme are being studied by the government, but they need to be linked with clear climate outcomes and a holistic approach to the ecosystem. According to the World Bank, between 1970-2013, Peninsular Malaysia, Sabah and Sarawak experienced surface mean temperature increase of 0.14°C-0.25°C per decade. It is projected that the frequency and intensity of heat waves experienced will increase significantly, due to the warming climate.\r\n The UN report research found that about 29,800 square kilometres of land feel the brunt of annual floods. It warned that it is projected that the area affected could increase due to rising sea level which may reach 0.25-0.5 metres by the year 2100 for Peninsular Malaysia and may reach 1.6 metres for Sabah. Some experts said that by 2040, all Malaysia mangrove zone have the potential of being submerged and by 2060 sea level rise might impact the industrial zones.